Enable Logging in Semarchy xDM
Use case: Something strange is happening in my Semarchy xDM application and I want to see the details of what happened...
Step-by-step guide
Enable Logging:
v4: In the Semarchy xDM Workbench, go to the Administration Console perspective, and select Logging Configuration (details of the available loggers are listed in the table at the end of this article).v5: On the Semarchy Welcome page, click on the Configuration Button. Select Logging Configuration
Default Logging Configuration# These comments do not appear in your Semarchy Logging Configuration # But the other lines are there log4j.appender.PDE=com.semarchy.commons.log4j.appender.pde.PDEAppender log4j.appender.PDE.Threshold=INFO # Skipping some lines log4j.logger.com.semarchy.platform.data.core.datamgr.IDataManager=INFO
Updated Logging Configuration to trace SQL queries# We update this line to say it's OK to log TRACE level messages in the PDE logger log4j.appender.PDE.Threshold=TRACE # We update any of the following next lines to send TRACE messages to the PDE logger # this one shows SQL executed from frontend + REST webservices call log4j.logger.org.springframework.jdbc.core.JdbcTemplate=TRACE, PDE # SQL executed from workbench and admin (legacy) log4j.logger.com.semarchy.commons.sql=TRACE, PDE # this one displays platform status change, platform READY is logged with INFO level, other statuses are logged with ERROR level log4j.logger.com.semarchy.mdm.datahub.services.query.datamgr.IDataManager=INFO, PDE
Logging Configuration to save queries to a file# Sometimes the convenience of PDE in the GUI is nice. Sometimes it's far better to log to a file. # Log all queries to semarchy.log (by default the logger named TOMCAT configured above logs to semarchy.log) #log4j.appender.TOMCAT.Threshold=TRACE #log4j.logger.com.semarchy.commons.sql=TRACE,TOMCAT
Log4j uses these logging levels (in order):
OFF, FATAL, ERROR, WARN, INFO, DEBUG, TRACE, ALL- Do something in the data navigator to generate a log. For example, open a Business View to explore at data.
- View the log:
In the Semarchy xDM Workbench, choose the menu Window -> Show View... -> Error Log
You'll see logs like this: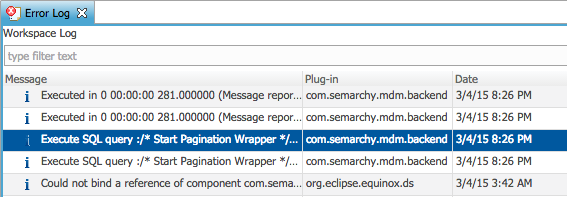
Look inside to find the SQL. - Don't forget to turn logging back off after you have resolved your issue(s).
Additional Details
com.semarchy.commons.log4j.appender.pde.PDEAppender is a Log4j Appender for our Error Log View allowing us to read logs from the web application.
We support all standard log4j appenders as well so we can log using several other ways.
Logging In JMS
Configuration to log in a JMS Topic defined in JNDI of the application server hosting convergence for MDM application (only topics are supported)
#replace standard appender with the one below in case of java.lang.ClassNotFoundException during log4j bootstrap
#com.semarchy.commons.log4j.appender.jms.JMSAppender
log4j.appender.jms=org.apache.log4j.net.JMSAppender

#JNDI name of topic and topic connection factory used to send logging
log4j.appender.jms.TopicBindingName=jms/logTopic
log4j.appender.jms.TopicConnectionFactoryBindingName=jms/ConnectionFactory
Available Loggers for Semarchy xDM
MDM apps loggers
- org.springframework.jdbc.core.JdbcTemplate: with DEBUG: All SQL executed from MDM apps
- org.springframework.jdbc.core.StatementCreatorUtils: with TRACE: log parameters set in prepared statements.
Rest API loggers
- com.semarchy.commons.sql: with TRACE: SQL executed from REST web services calls before v4.3
- org.springframework.jdbc.core.JdbcTemplate: with DEBUG: All SQL executed REST web services calls (since v4.3)
- org.springframework.jdbc.core.StatementCreatorUtils: with TRACE: log parameters set in prepared statements.
- org.apache.cxf.services: With INFO: REST request, response, and fault between backend and frontend (Semarchy 4.4.x and above only)
- org.apache.cxf.interceptor.LoggingInInterceptor and org.apache.cxf.interceptor.LoggingOutInterceptor: with INFO : REST request, response, and fault between backend and frontend (before Semarchy 4.4.x)
Data Notifications loggers
com.semarchy.mdm.datahub.datanotif: with DEBUG, logs every action done on Data Notifications during runtime (creation, modification, processing, deletion...)
Job loggers
- com.semarchy.platform.engine.core.impl.DefaultStandaloneEngineImpl: with DEBUG level it logs all submitted jobs, ERROR level can be used to log panic shutdown of the engine
- com.semarchy.platform.integration.polling.IntegrationLoadDequeuer: with DEBUG level it logs every polled interval (even if no batches are retrieved)
- com.semarchy.platform.engine.core.impl.product.SL4JExecutionMonitor: with DEBUG level, it logs execution progress of engine jobs, see /wiki/spaces/TKB/pages/4227077 for more informations
- com.semarchy.platform.product.notification: Job notification, with DEBUG level shows calls to notification servers and ERROR logging for notification failures
for http notifications:- org.apache.http.headers: DEBUG shows the headers that were sent
- org.apache.http.wire: DEBUG shows the data sent in the http request
Dashboard apps loggers
- org.springframework.jdbc.core.JdbcTemplate: with DEBUG: All SQL executed from Dashboard apps
- org.springframework.jdbc.core.StatementCreatorUtils: with TRACE: log parameters set in prepared statements.
Workbench loggers
- com.semarchy.commons.sql: with TRACE: SQL executed from workbench and admin
- com.semarchy.commons.mda.persistence.massdelete.ObjectTreeDeleter: With TRACE: displays the delete queries (triggered from execution logs delete) (Semarchy 4.4+).
Platform loggers
- com.semarchy.mdm.datahub.services.query.datamgr.IDataManager: Logs database operations performed by the platform for the MDM applications while browsing data. DEBUG logs all queries and execution times
- com.semarchy.platform.setup.IPlatformManager: Logs platform status changes. INFO traces normal status changes. ERROR traces abnormal statuses
License Synchro loggers
log4j.logger.org.apache.cxf.services.WebClient: with DEBUG (since 5.3 only), logs http exchanges between xdm and license server
Plugins loggers
- com.semarchy.platform.engine.PluginExecution: DEBUG Plugin enrichers and validators feedback, TRACE logs enricher and validation result for all rows
Melissa plugin enrichers loggers
- com.semarchy.engine.plugins.melissa: DEBUG
- Also set log4j.logger.org.apache.cxf=DEBUG, log4j.logger.org.apache.cxf.services=DEBUG, log4j.logger.com.semarchy.platform.engine.PluginExecution=DEBUG
Cache Usage Logging
- com.semarchy.commons.util.groovy.GroovyEvaluatorService: DEBUG
User access (from KB: Best Practice - configuring user access for a DEV instance)
- log4j.logger.org.springframework.security.ldap=TRACE – New in 5.3 to log both LDAP and AD IDP
org.apache.catalina.core.ContainerBase.[Catalina].[localhost].[/semarchy].level = ALL
org.apache.catalina.realm.level = ALL
org.apache.catalina.realm.useParentHandlers = true
org.apache.catalina.authenticator.level = ALL
org.apache.catalina.authenticator.useParentHandlers = true
- com.semarchy.tool.jee.tomcat.level = ALL if using the com.semarchy.tool.jee.tomcat.JNDIRealm class
Related articles
Filter by label
There are no items with the selected labels at this time.